 Paris Observatory Geodetic VLBI CenterParis Observatory Geodetic VLBI Center
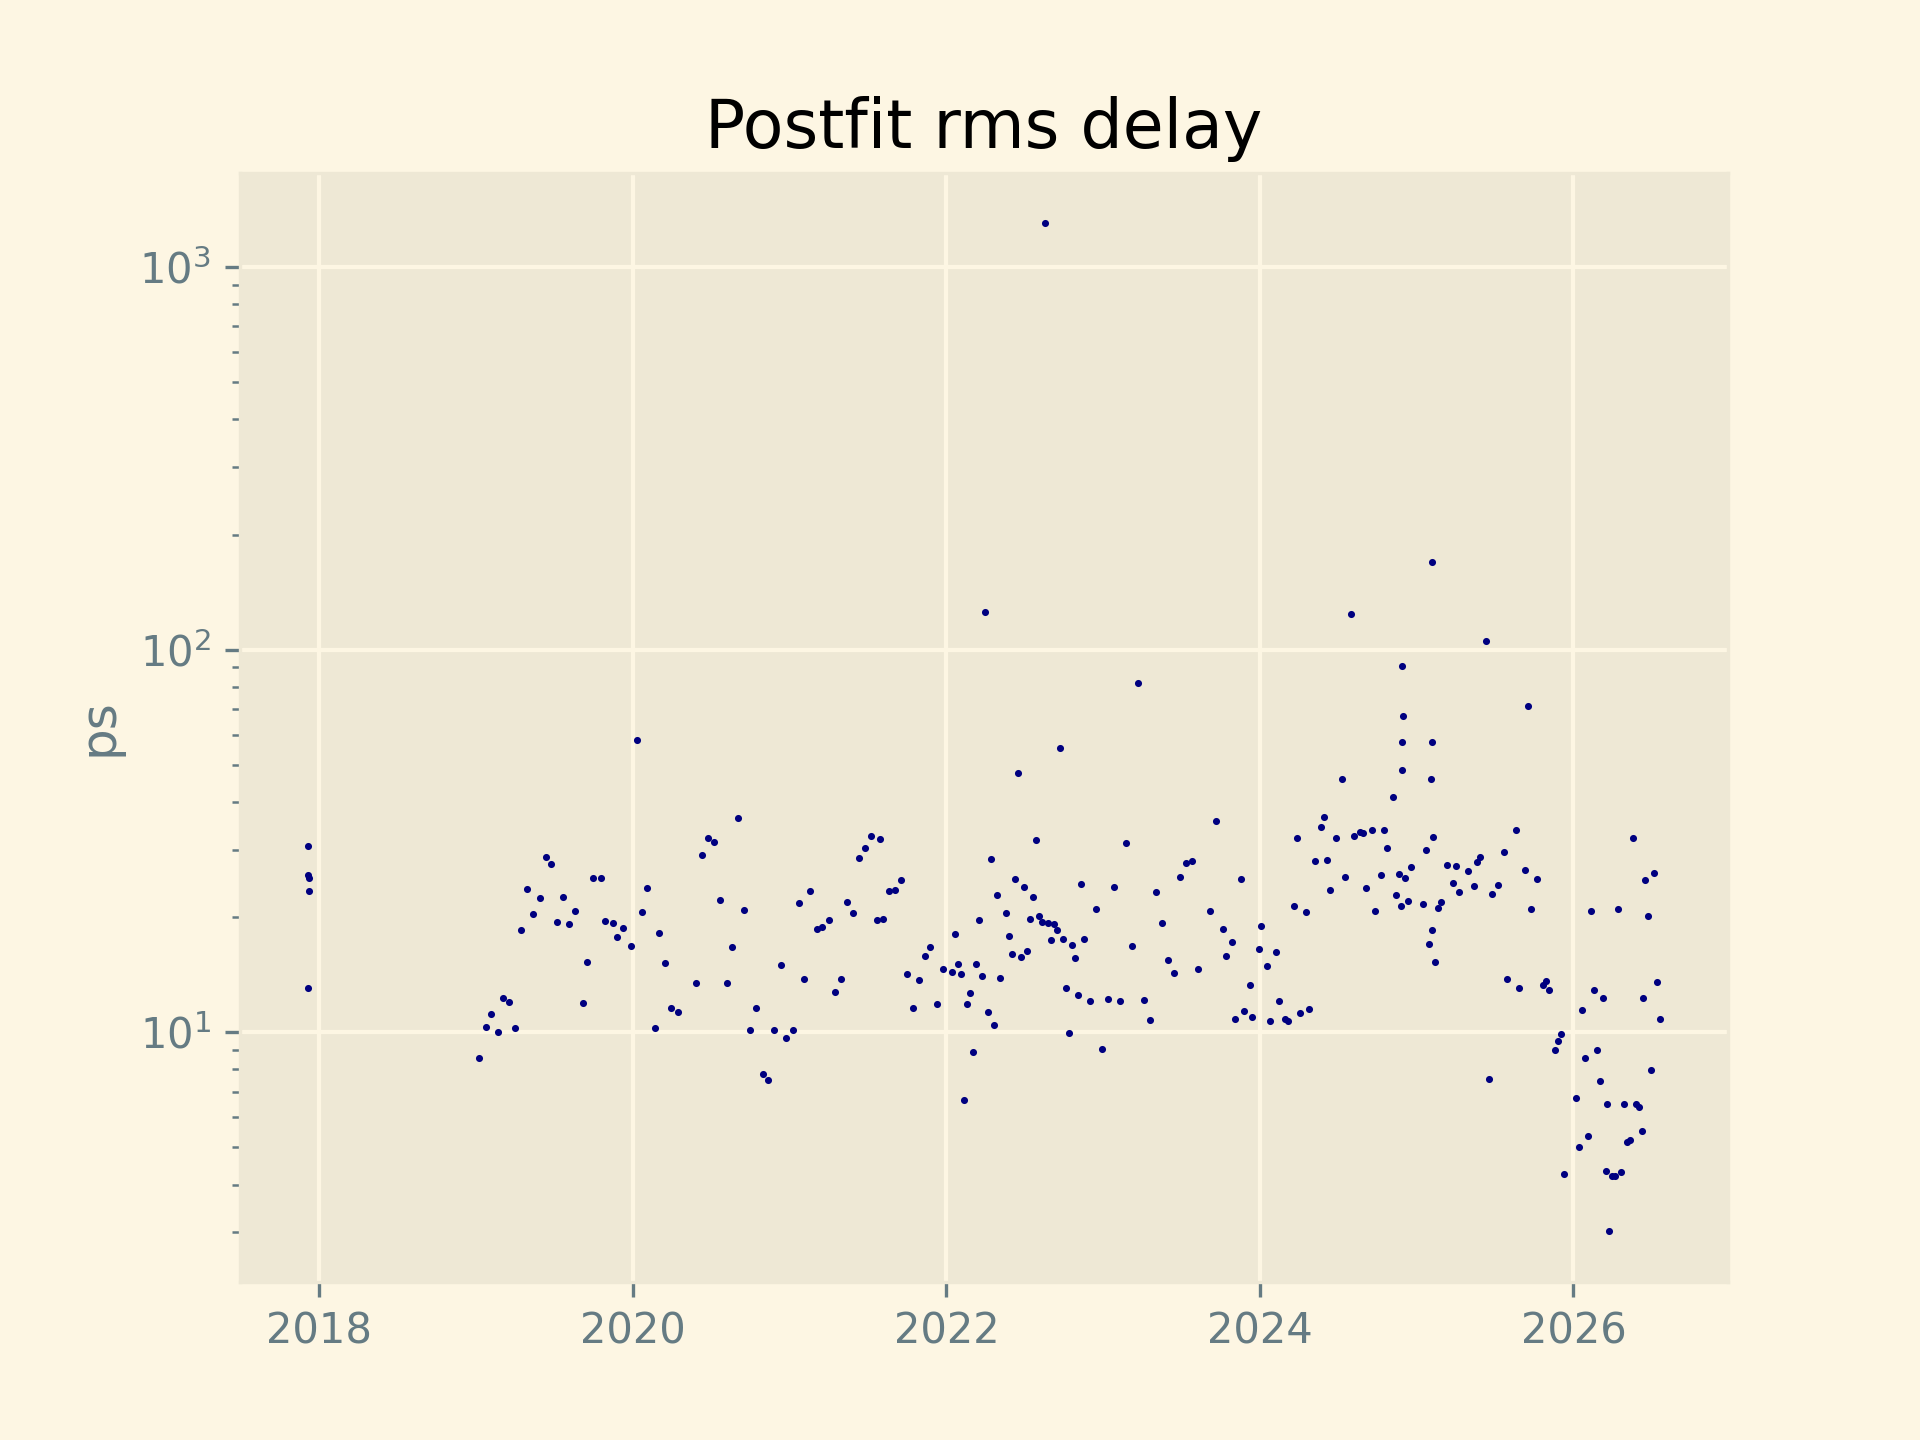
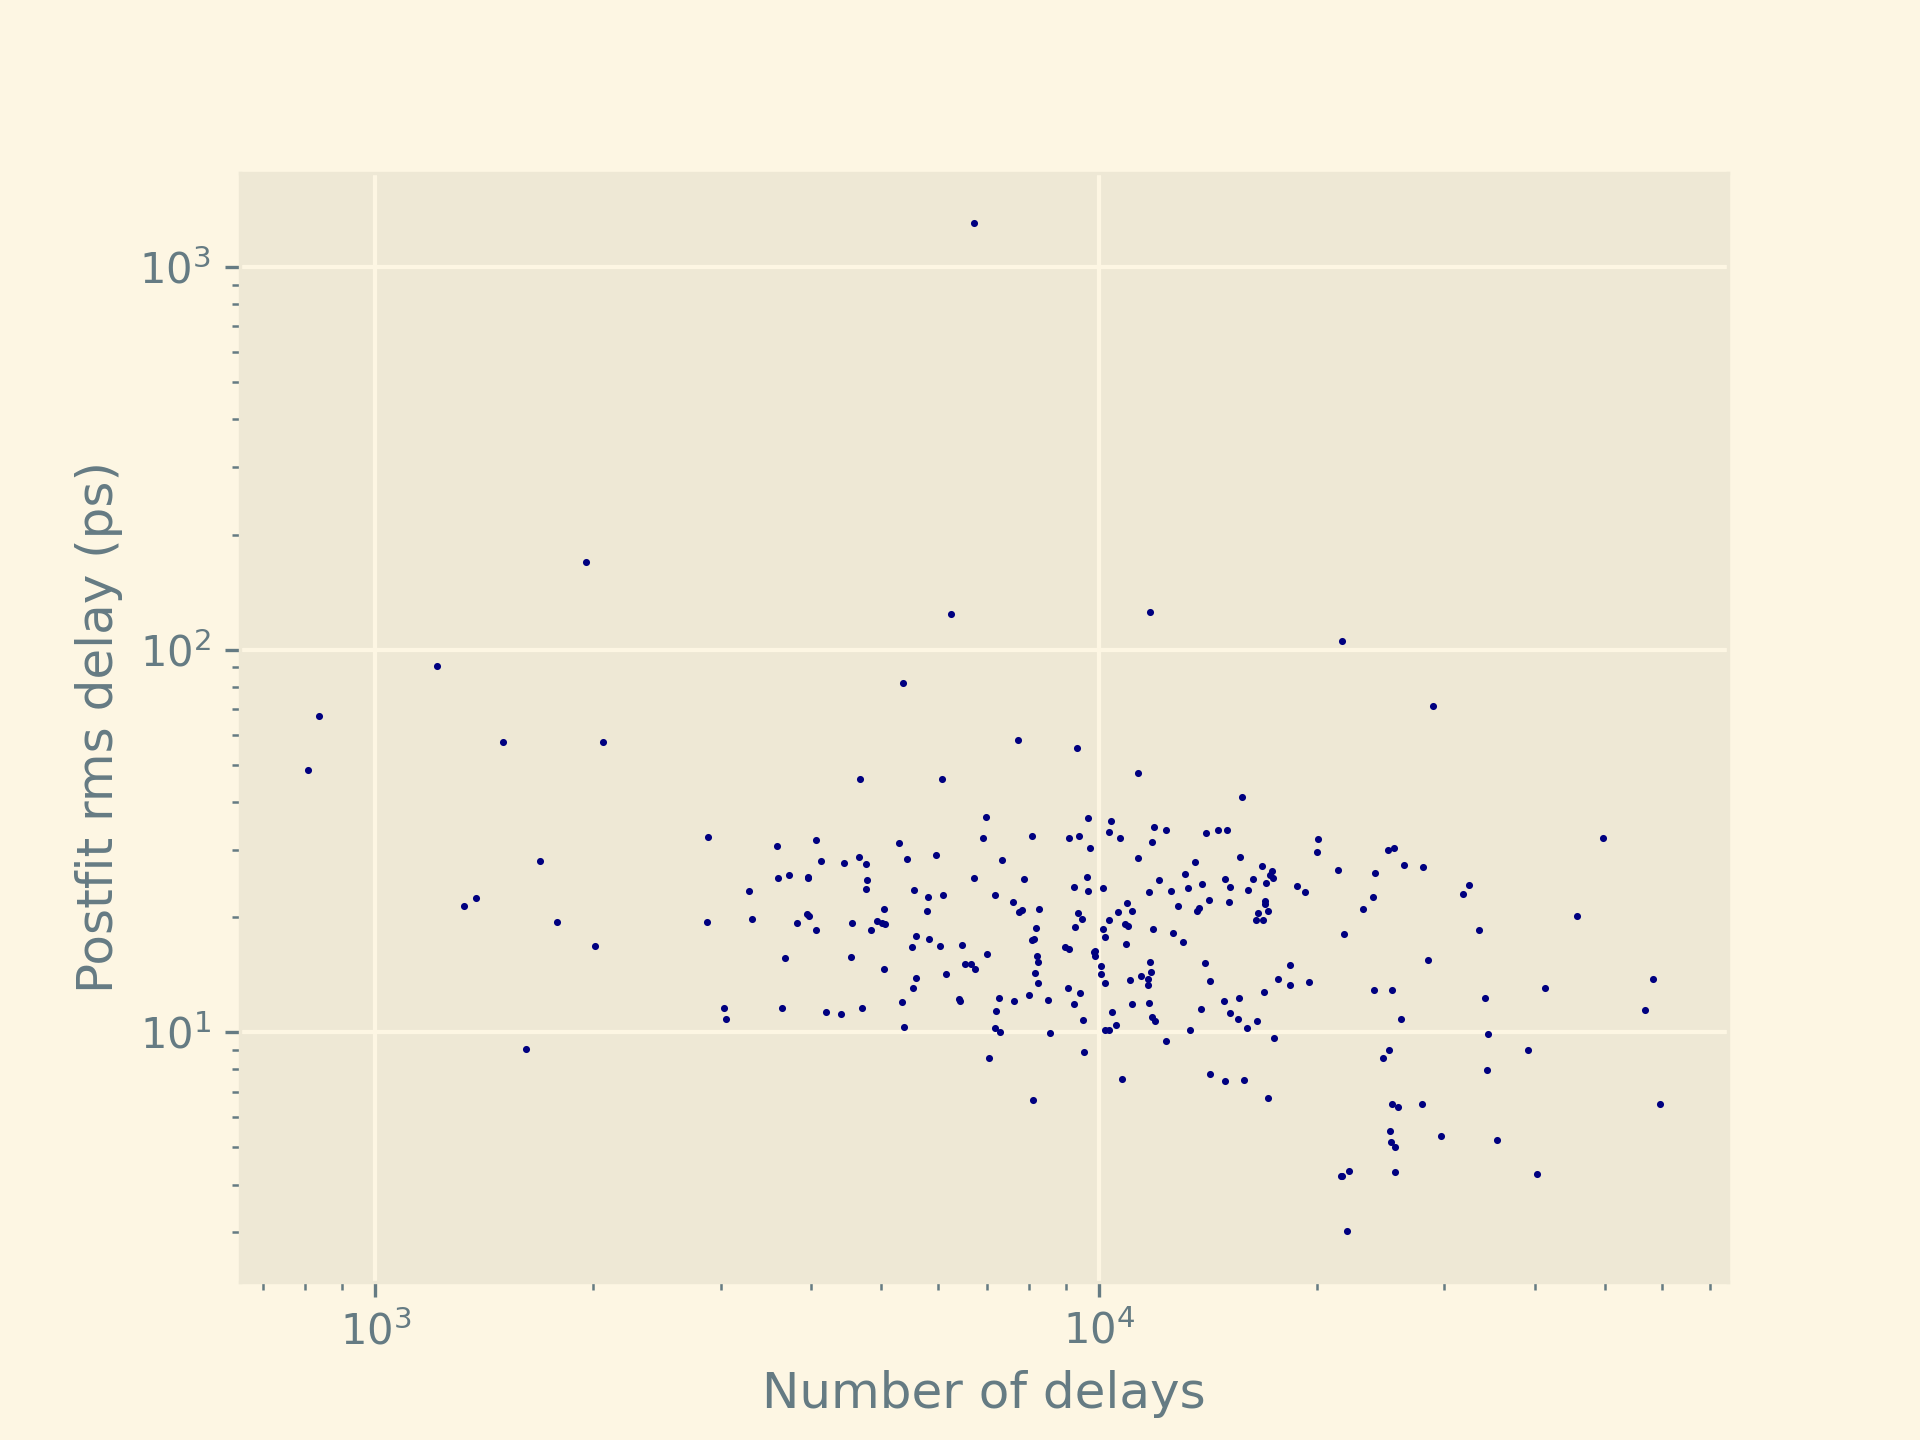
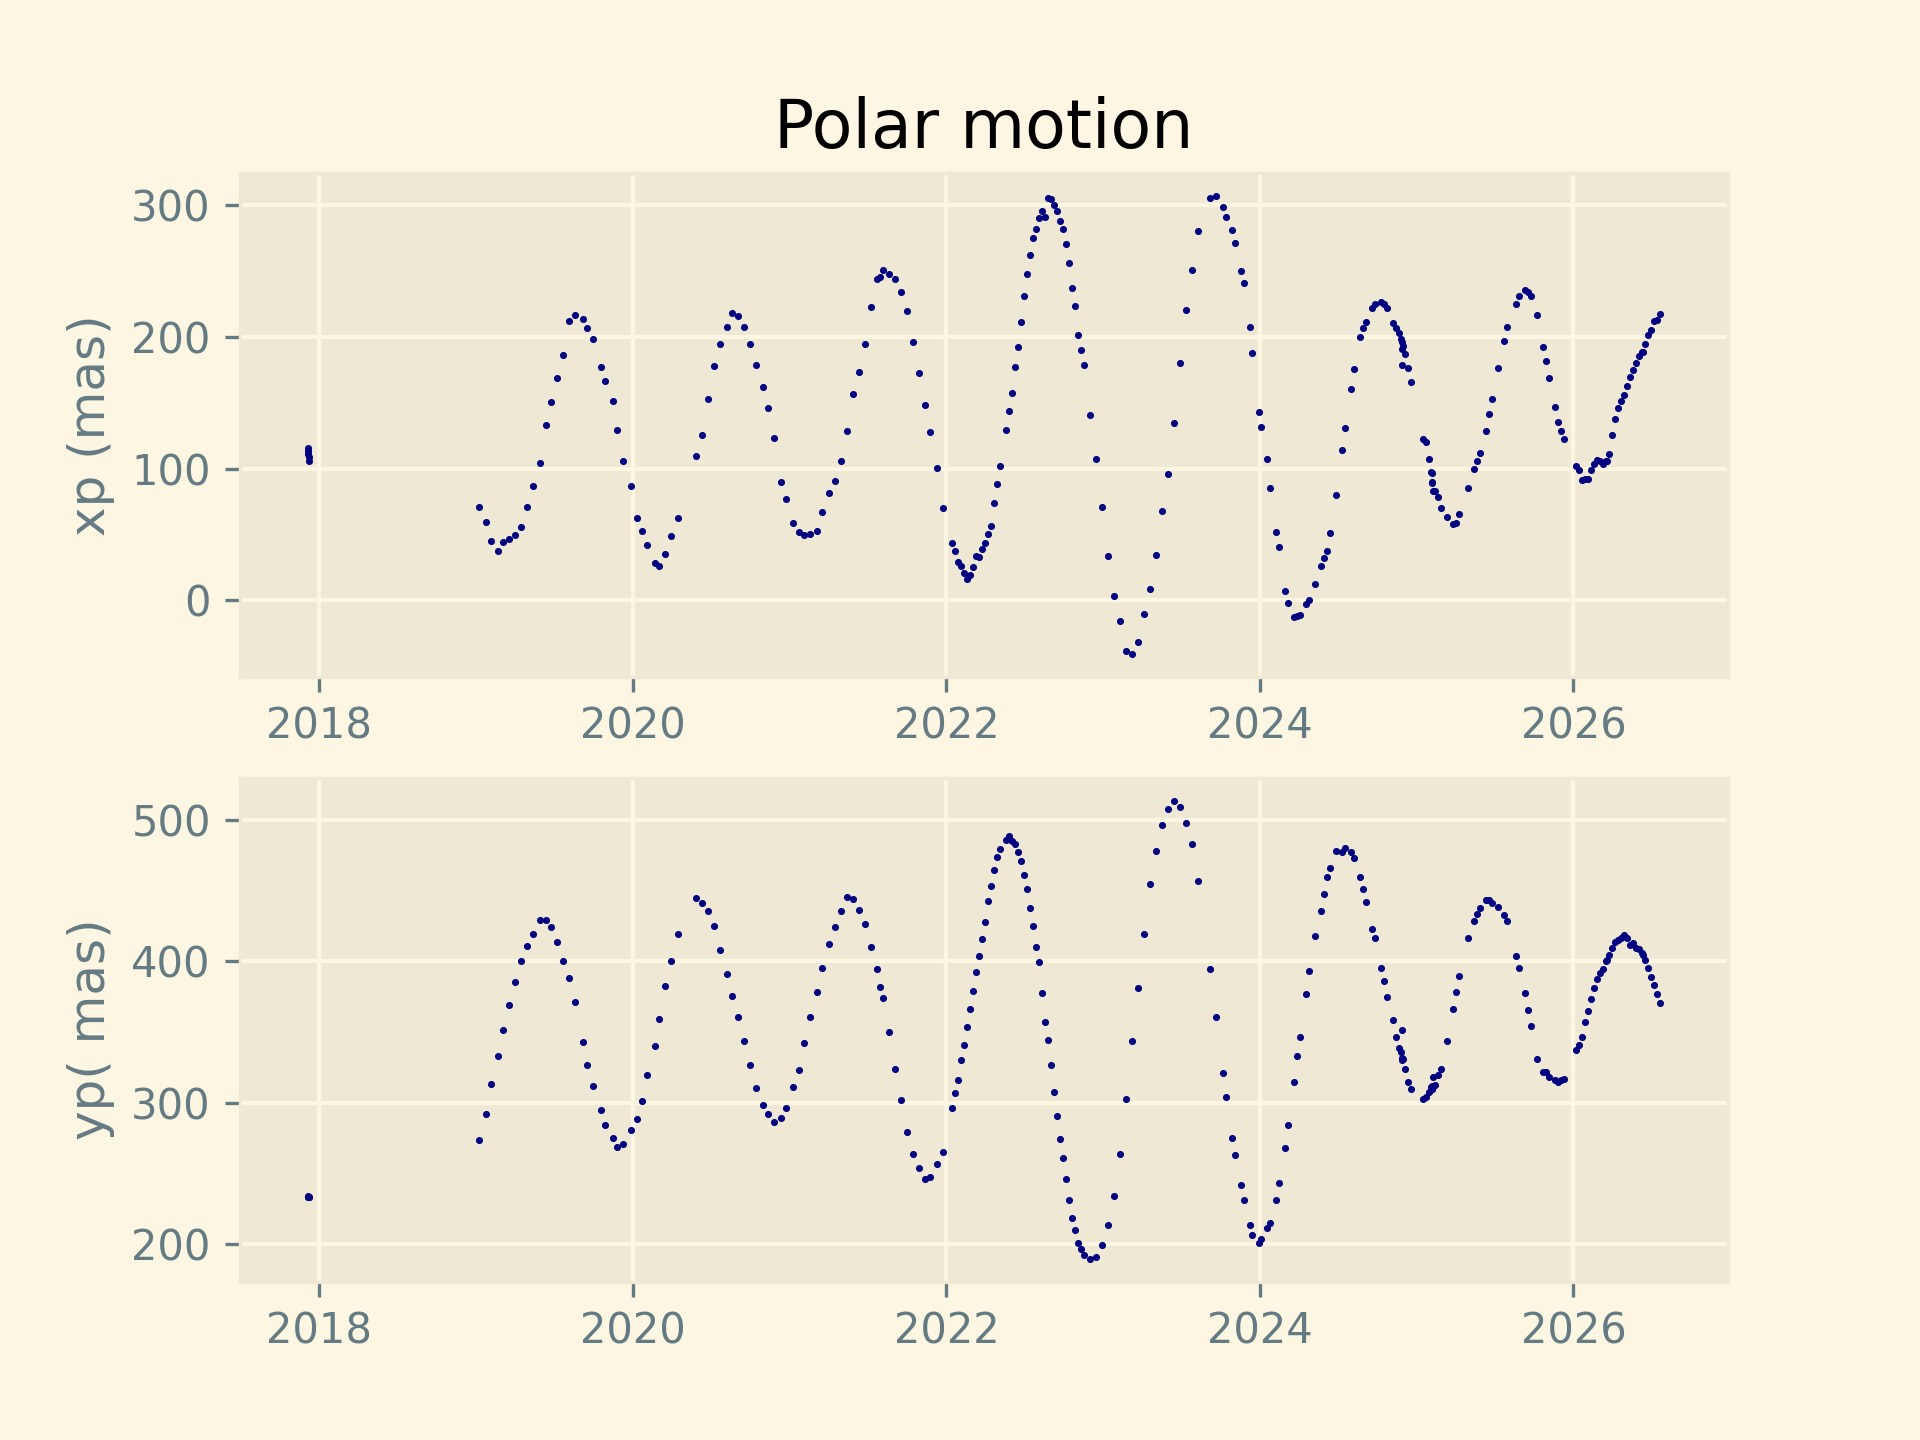
This is the solution relevant to VGOS sessions only.
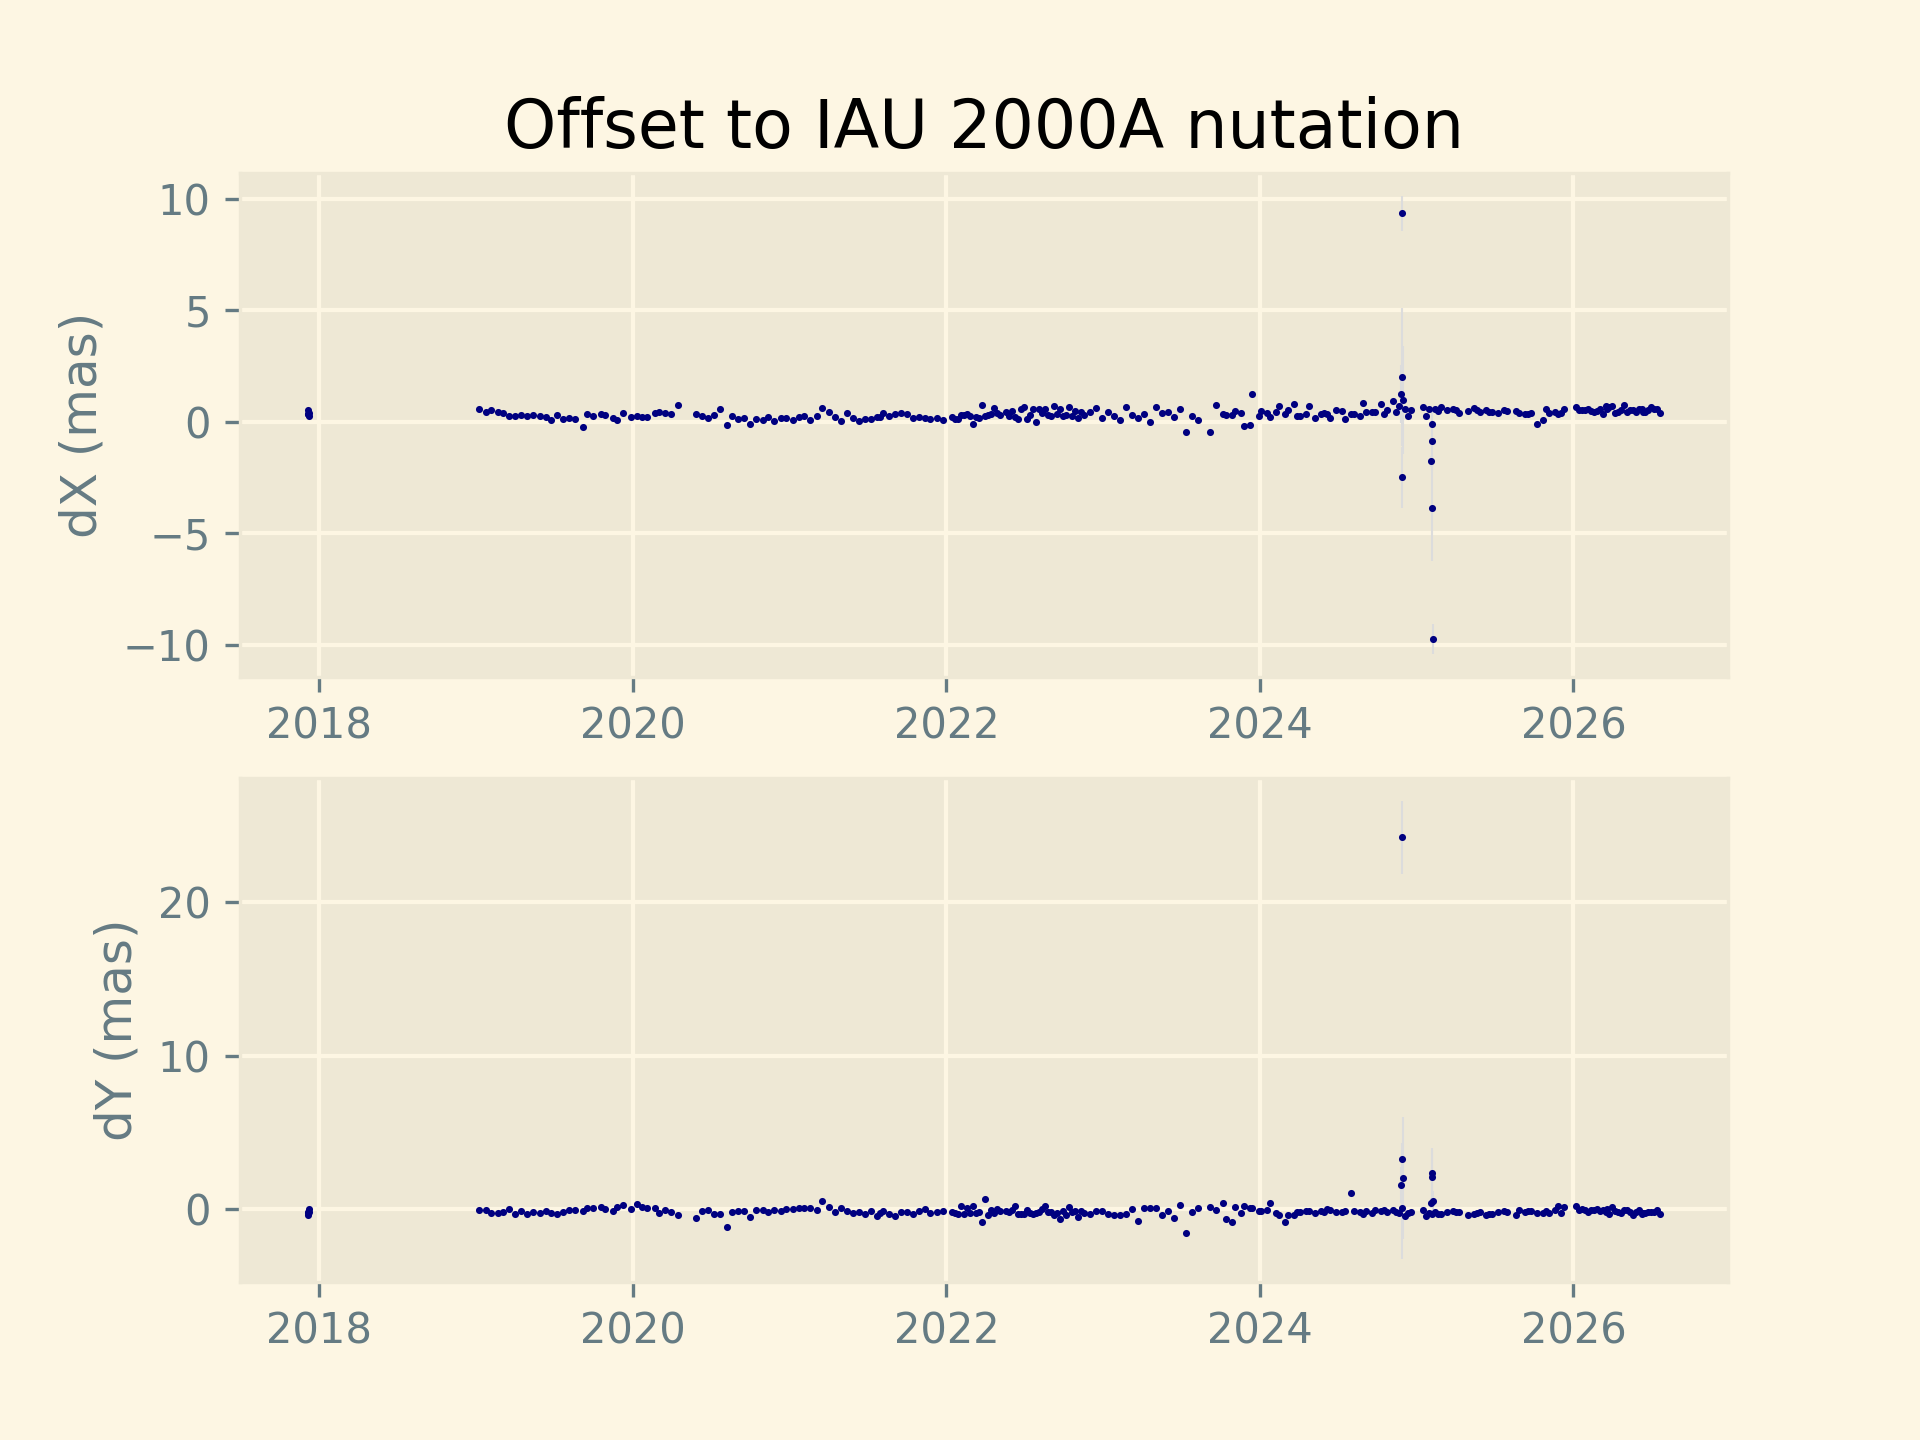
In the following plots, the points resulting from the global solution are in blue, those resulting from the rapid updates are in red.
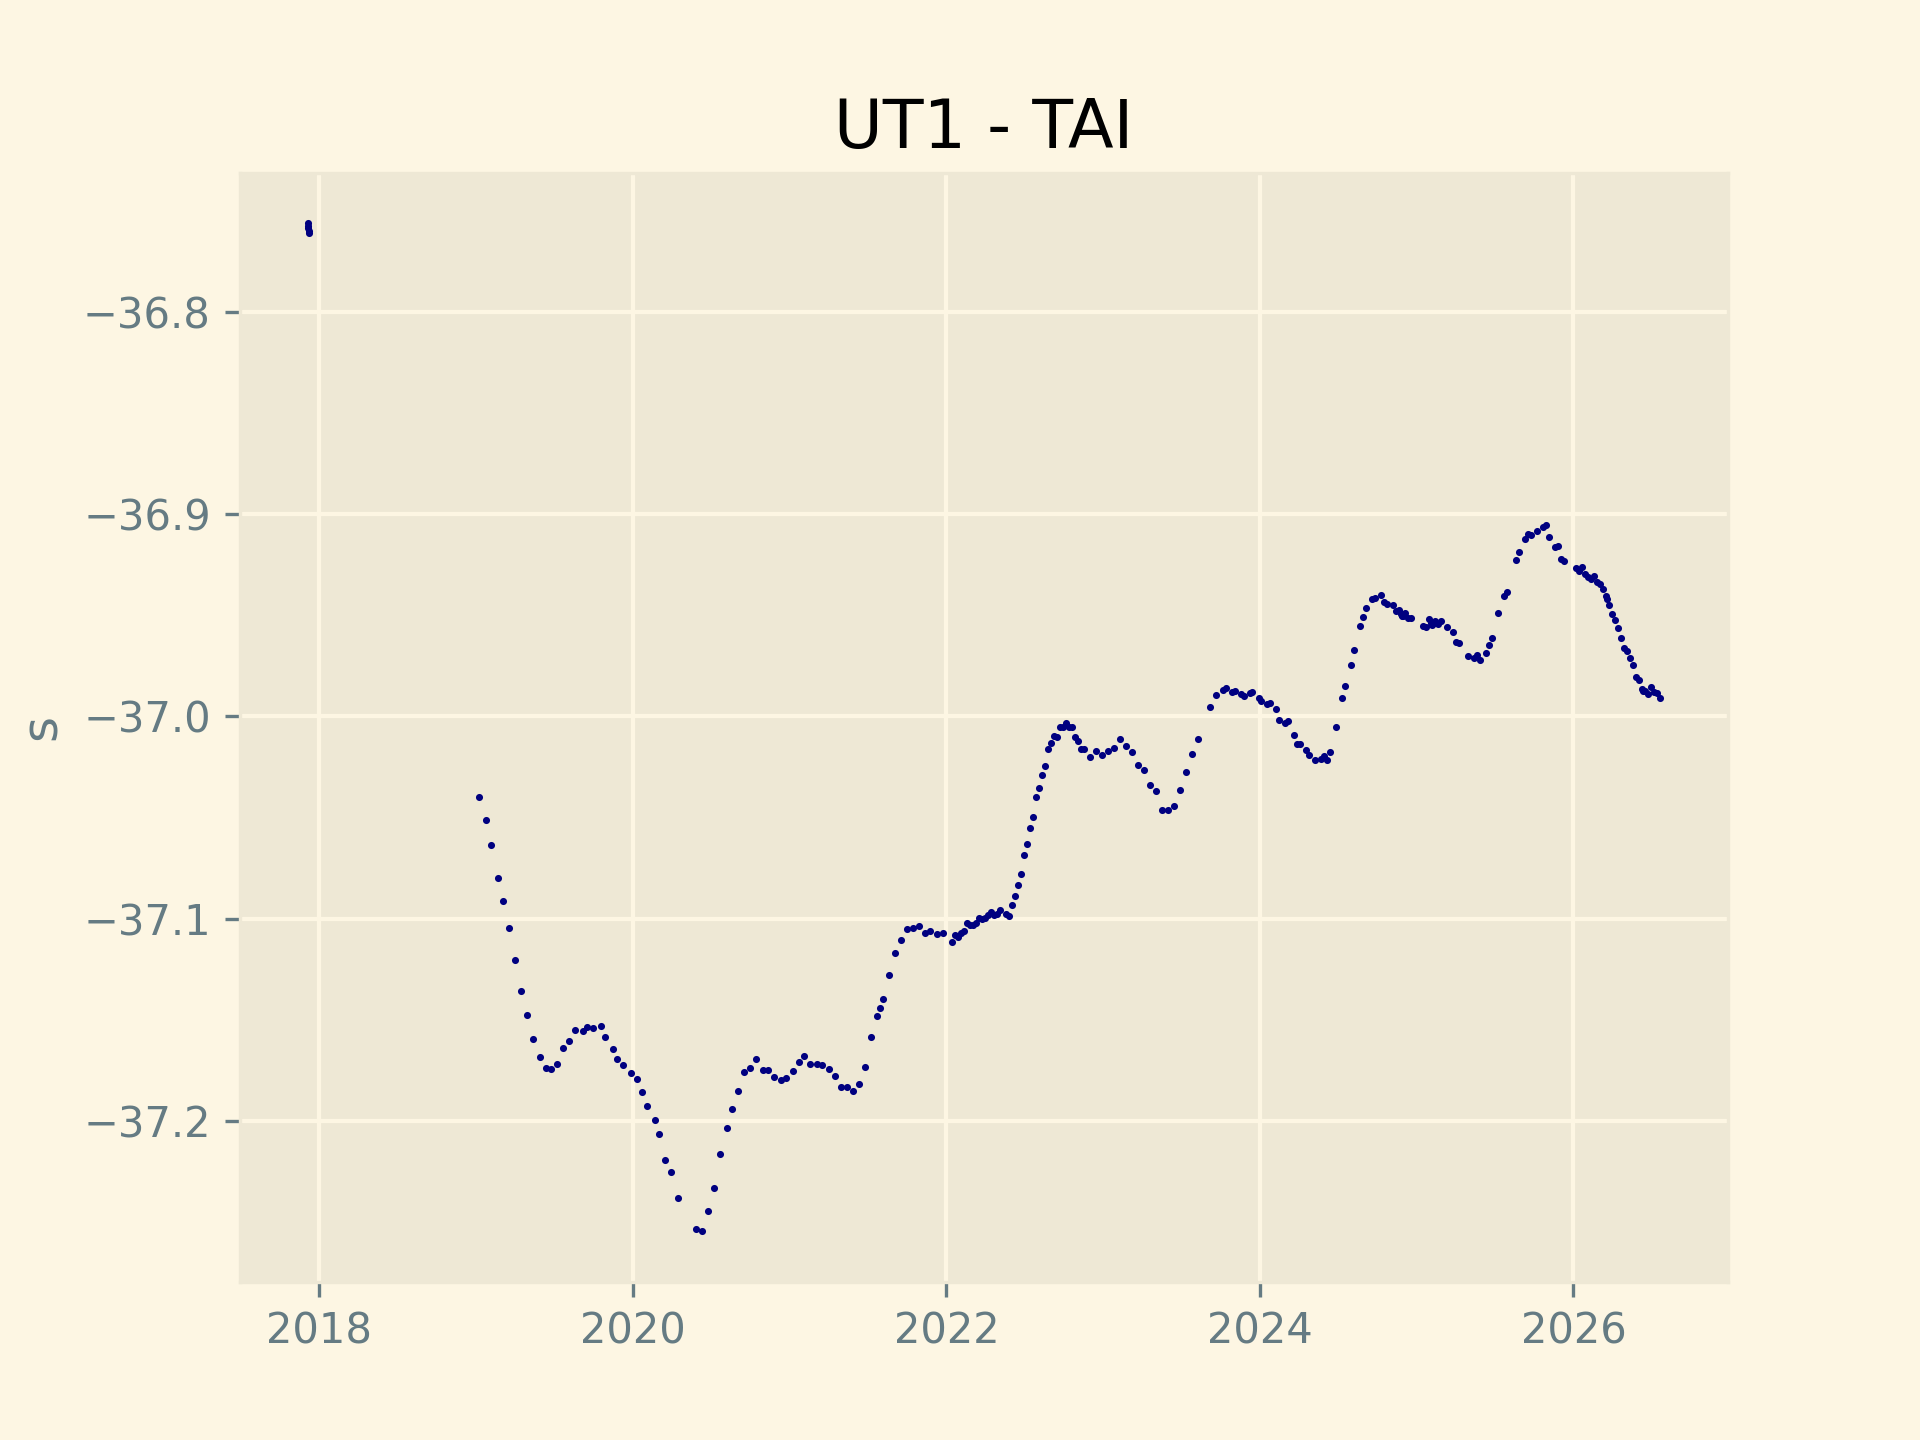
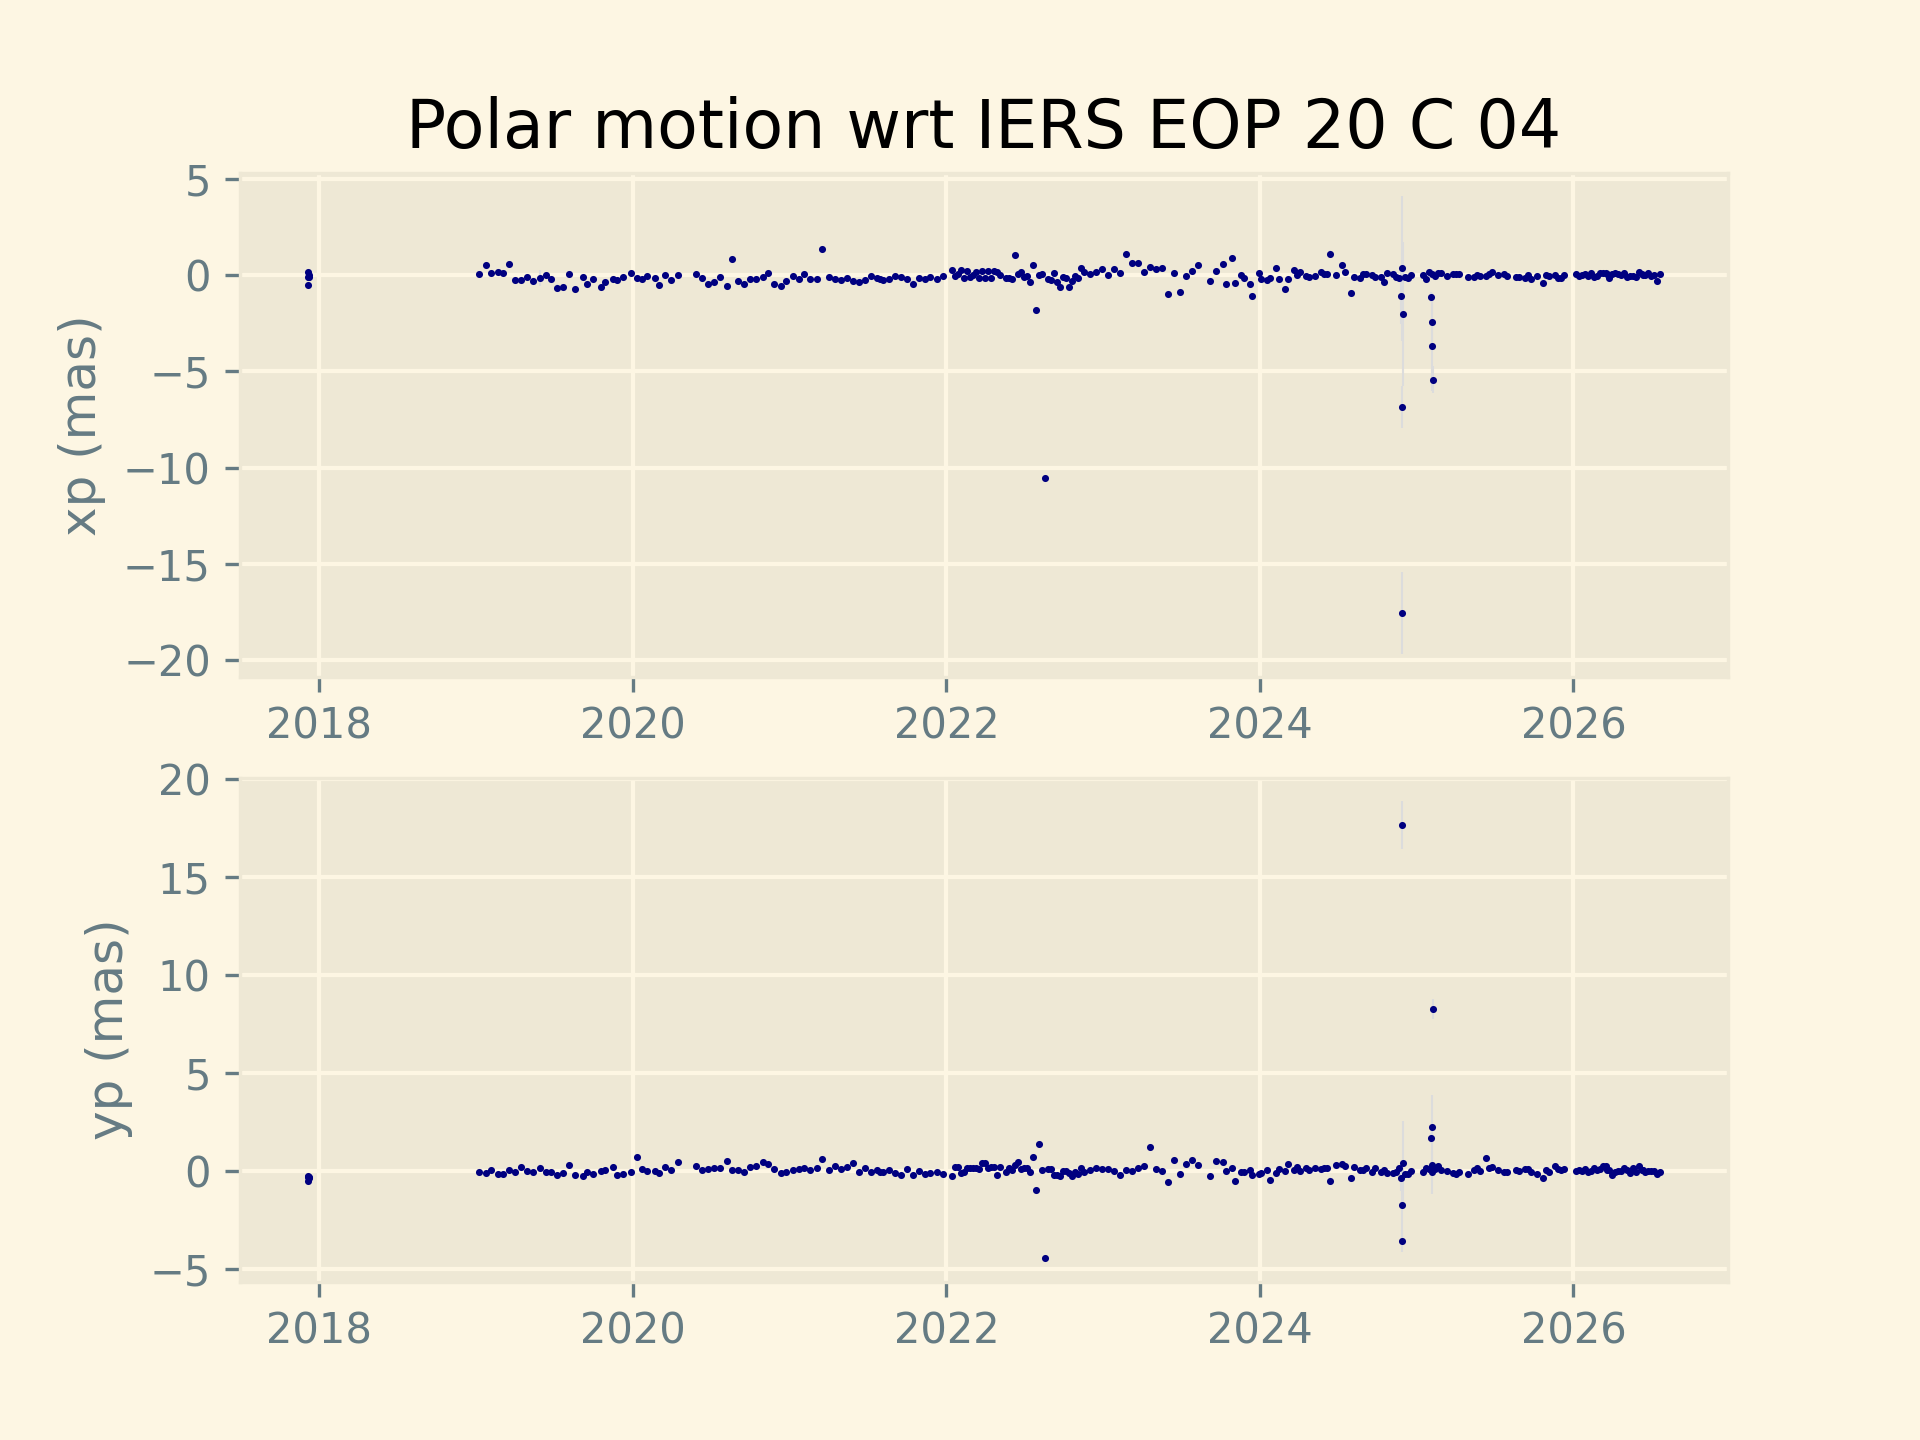
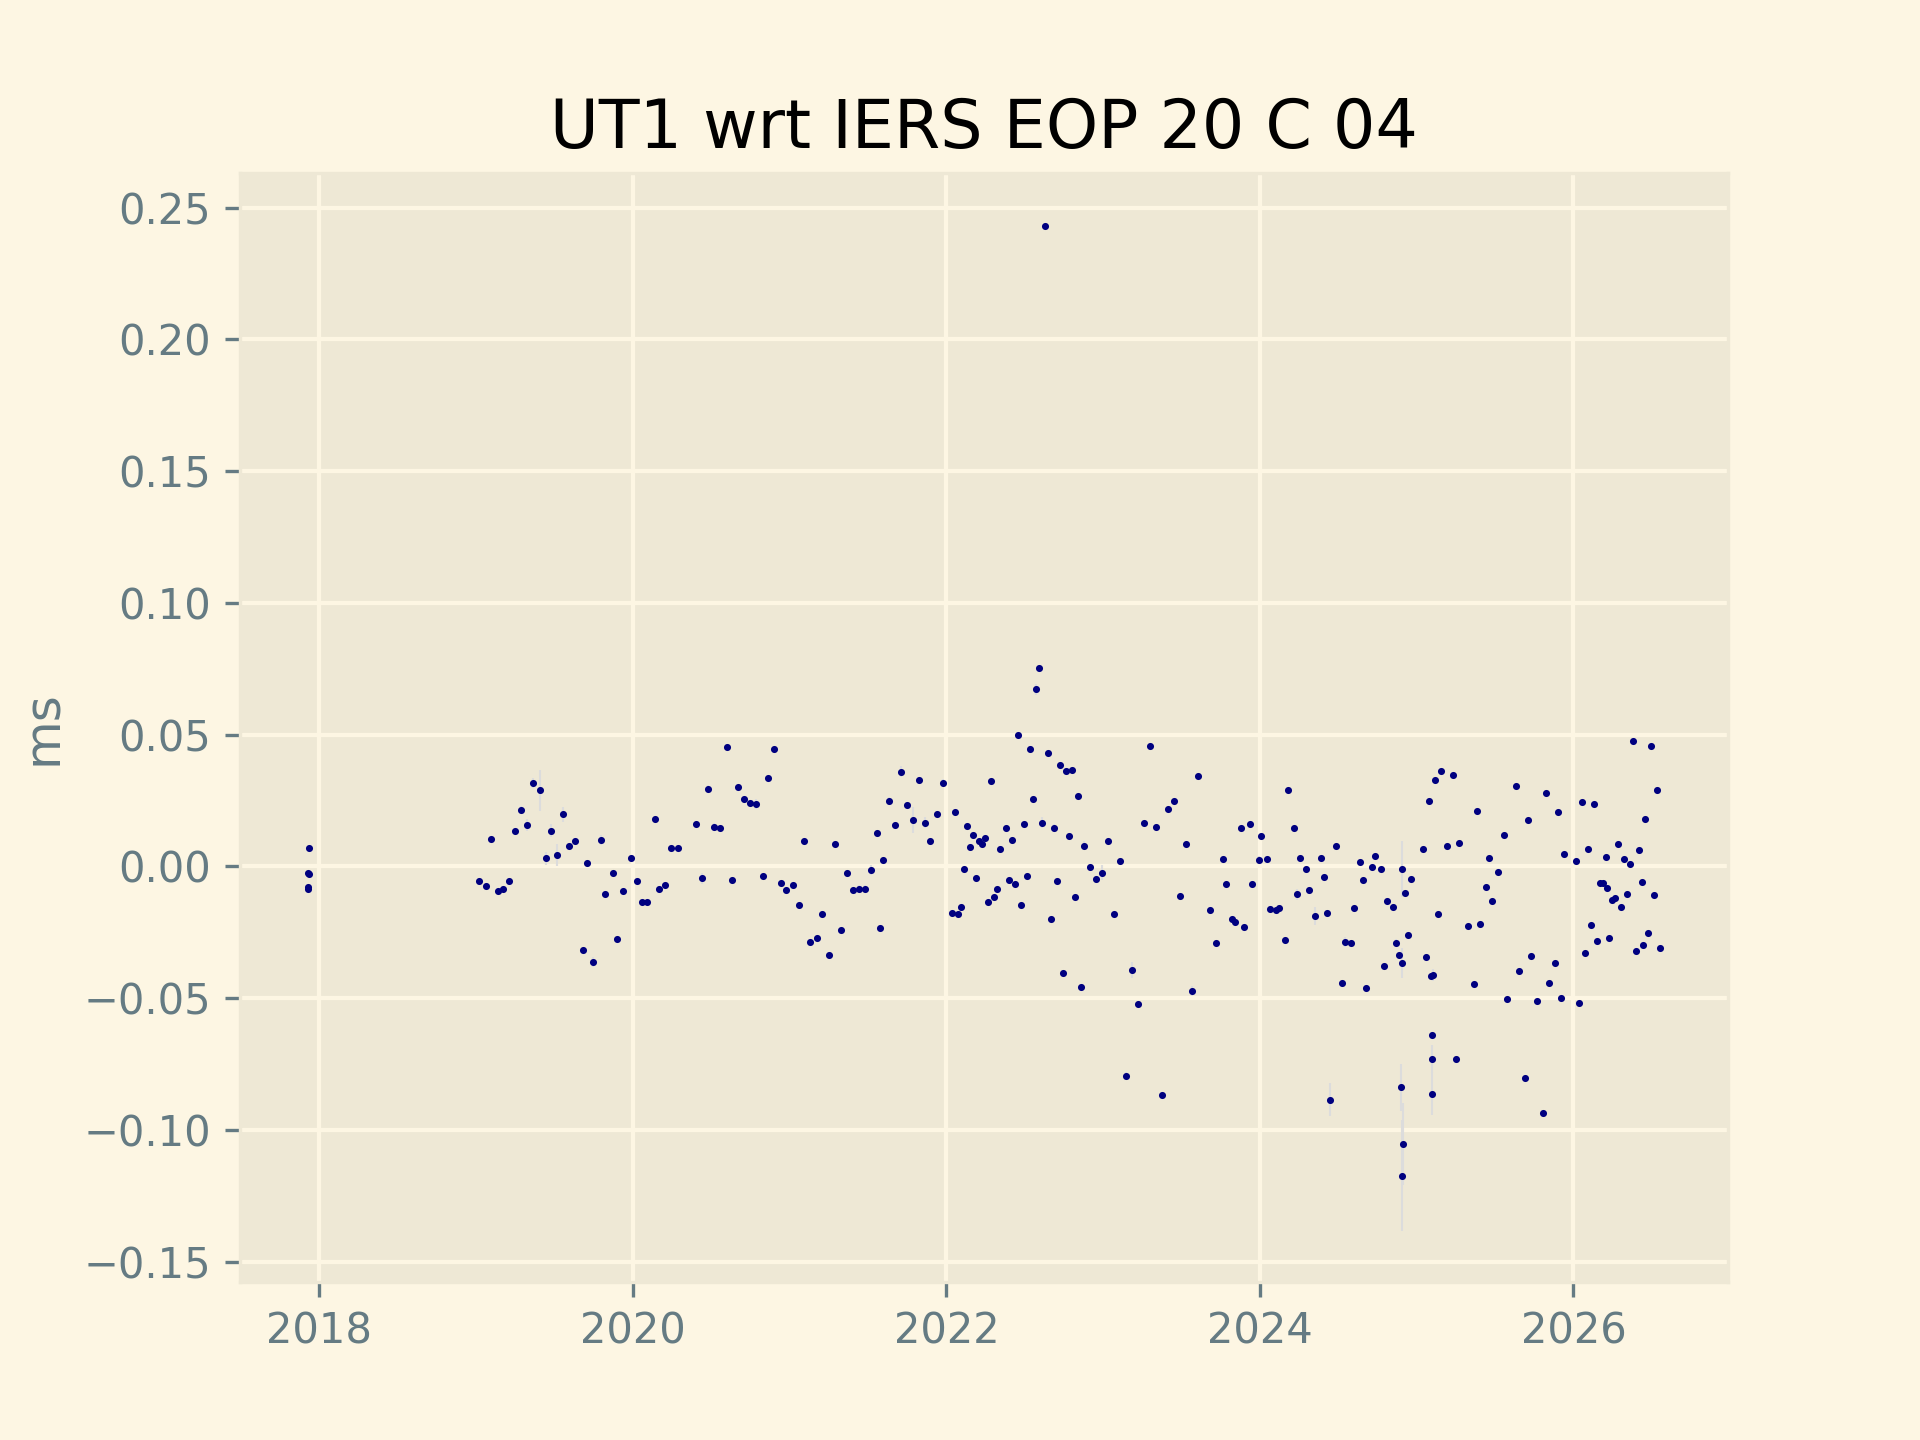
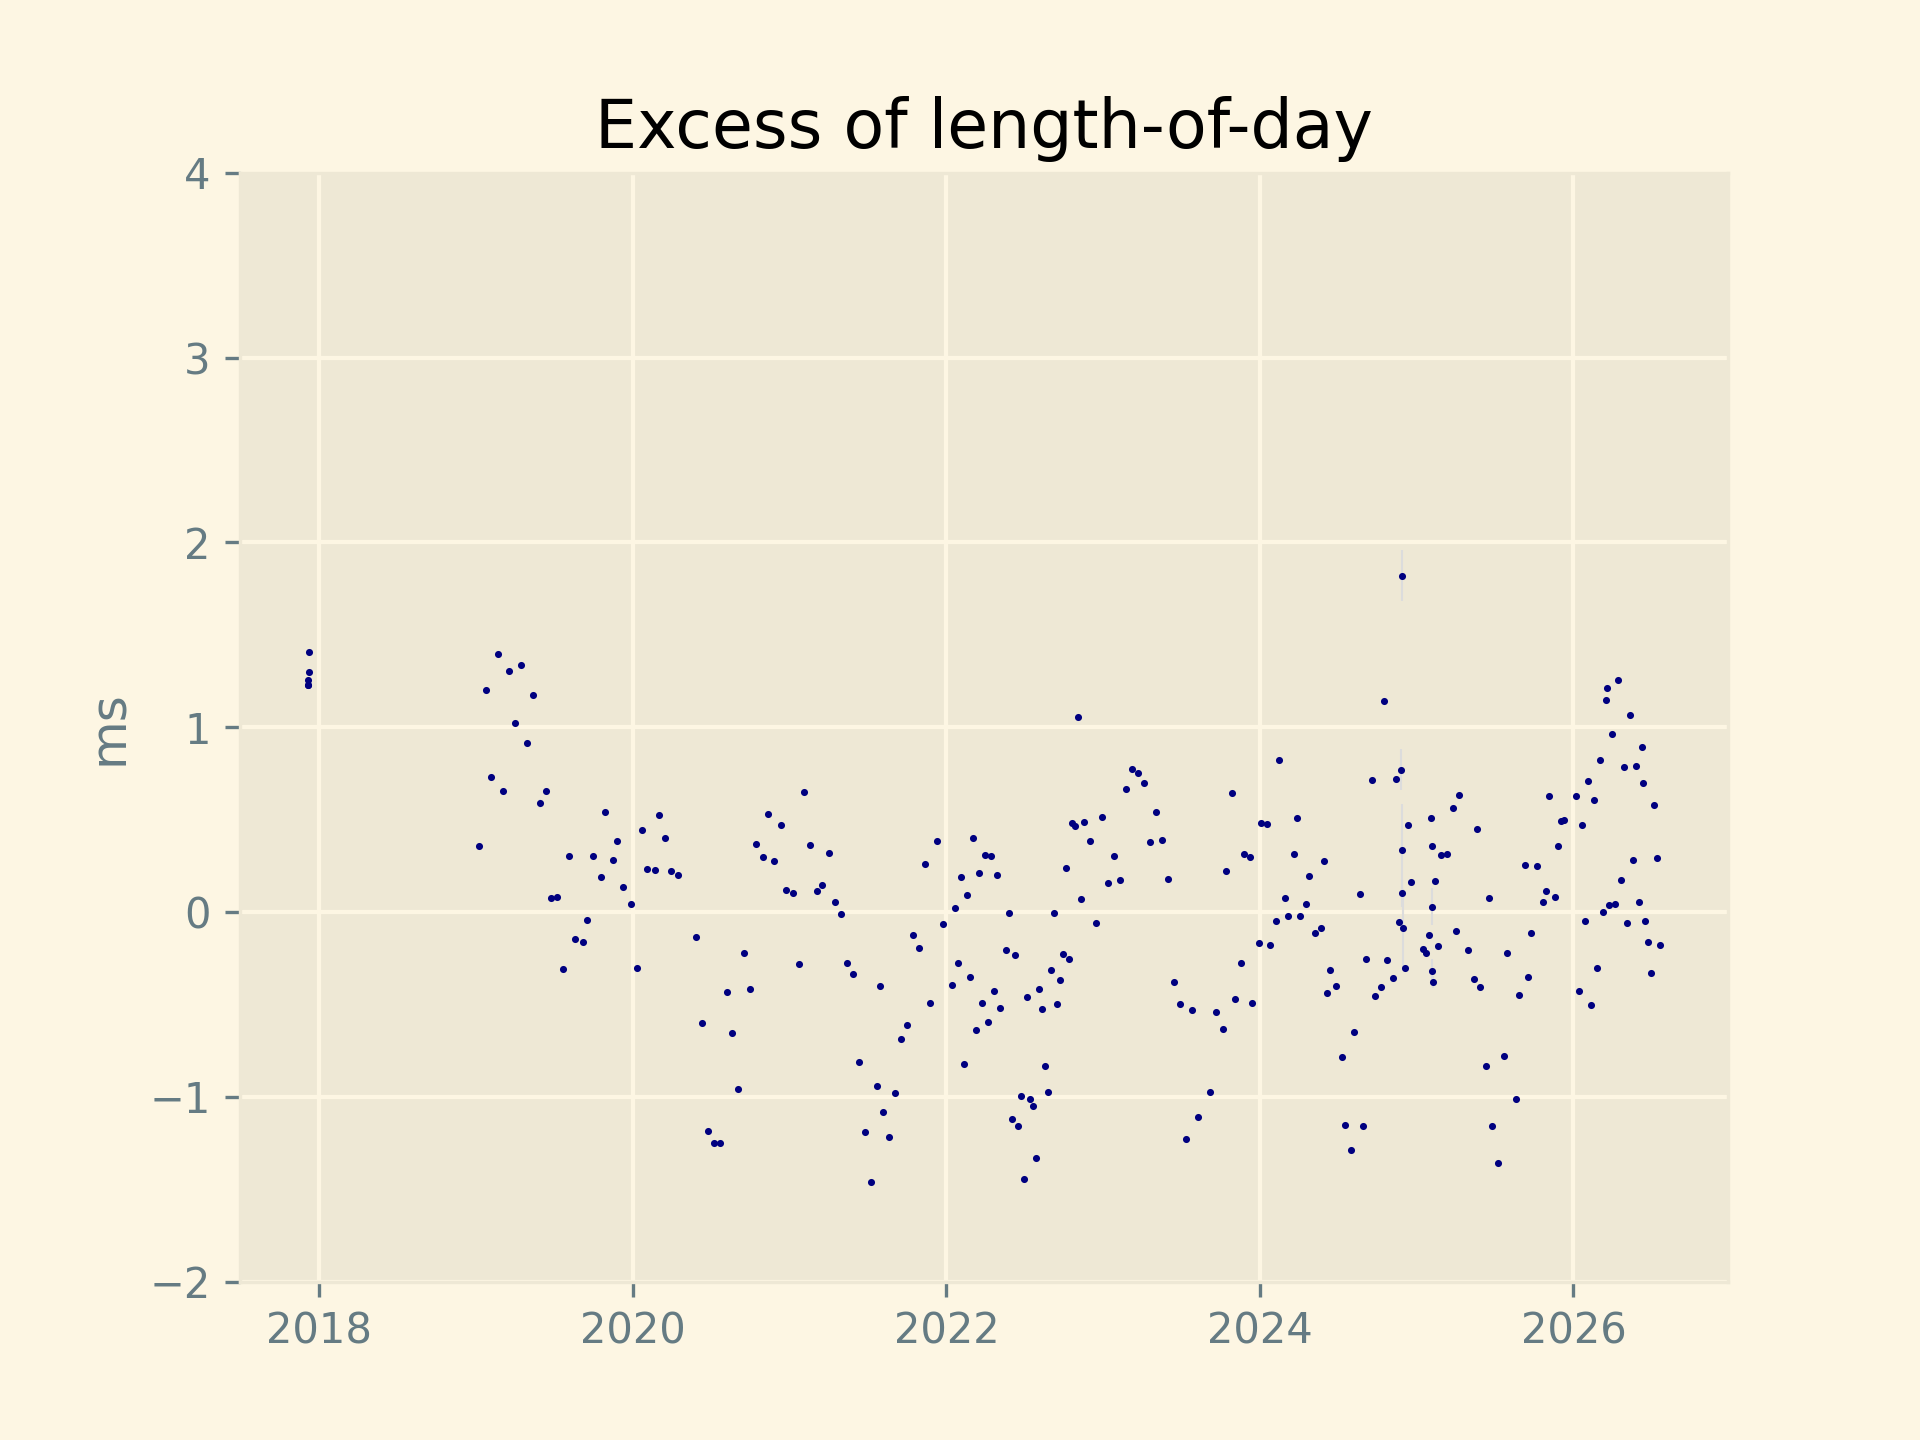
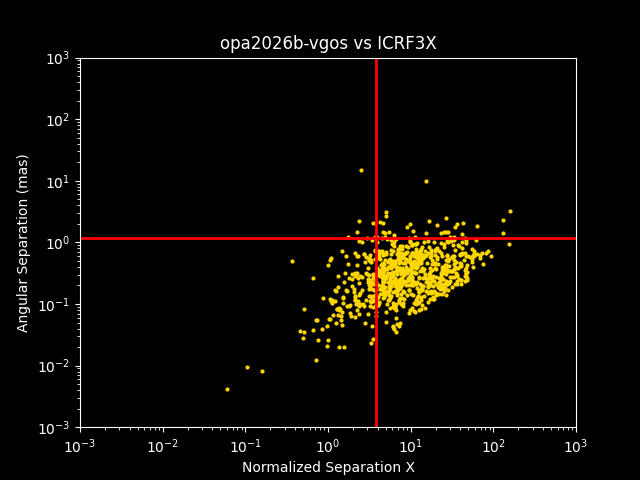
Below, the VGOS celestial reference frame is briefly compared with ICRF3 S/X.
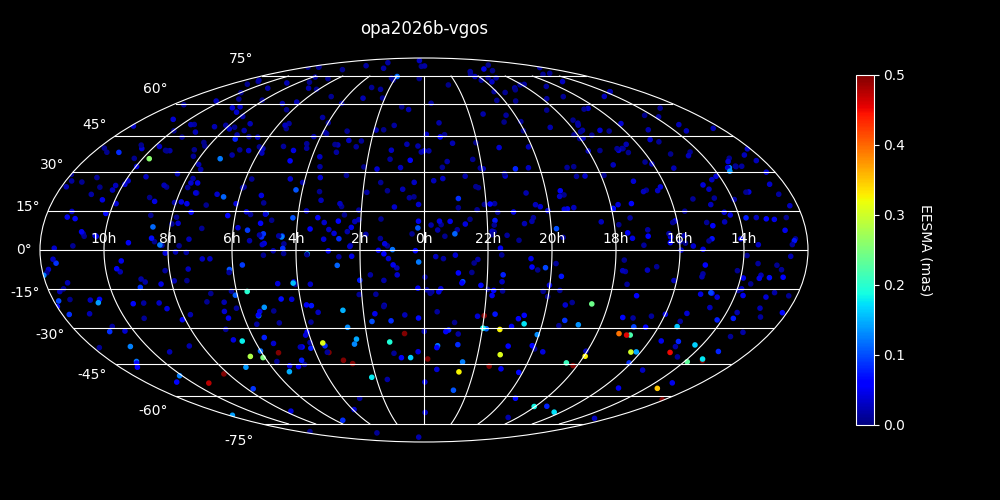
Sky map of error ellipse semi-major axis (EESMA).
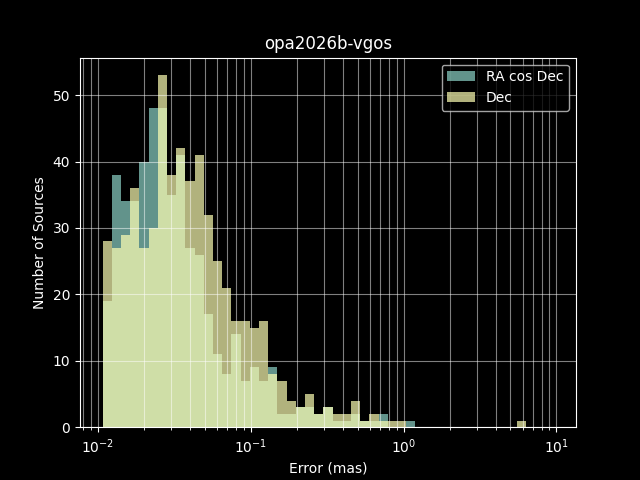
Distribution of errors in RA and Dec.
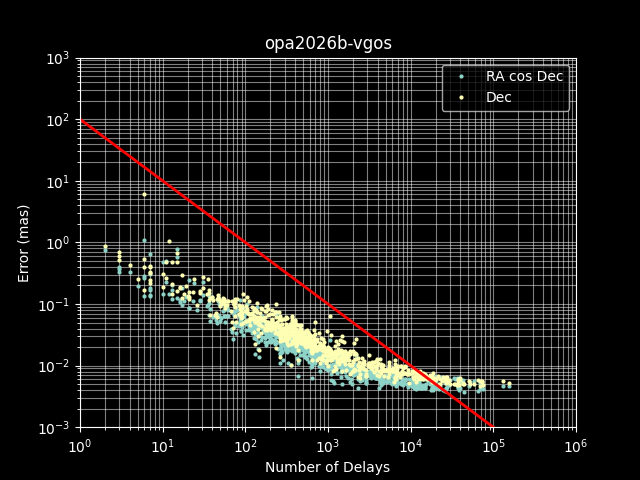
EESMA versus the number of delays.
The normalized separation as a function of the angular separation. The red line on the normalized separation scale is the limit beyond which there is no expected survival source for a Rayleigh distribution of parameter 1. Conversely, the red line on the angular separation scale is the angular separation leaving only 5% of the sample beyond.
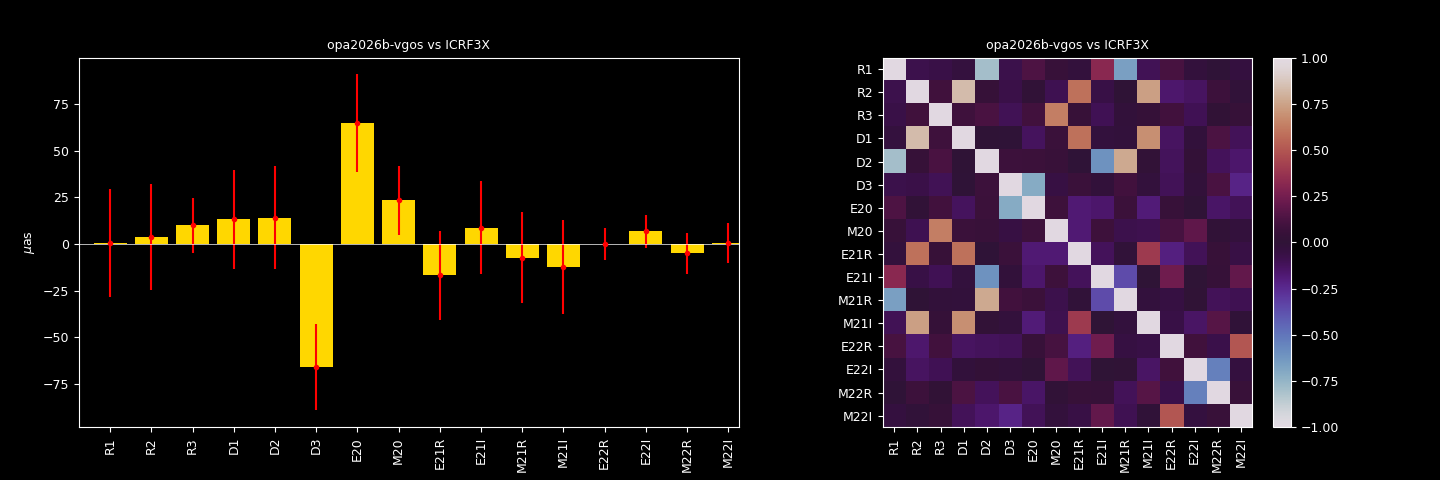
(Left) Transformation parameters between ICRF3 and opa2026b adjusted on positional differences after removal of outlier sources following the method explained in Charlot et al. (2020) and (Right) their correlations.