 Paris Observatory Geodetic VLBI CenterParis Observatory Geodetic VLBI Center
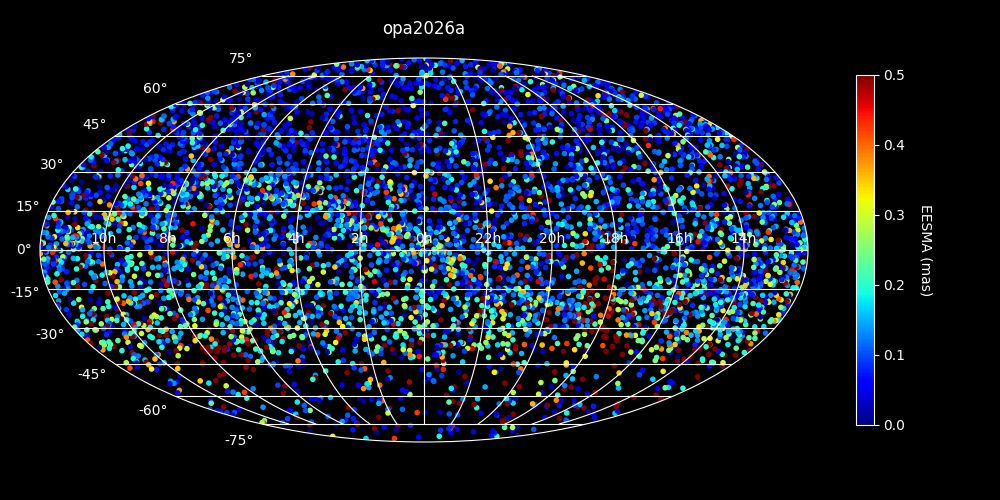
This page presents the current VLBI celestial reference frame established at Paris Observatory using the full set of available geodetic VLBI multibaseline experiments at S/X (no VGOS, no K-band). The catalog of positions is compared against the current fundamental reference frame (ICRF3 with native formal errors).
|
|
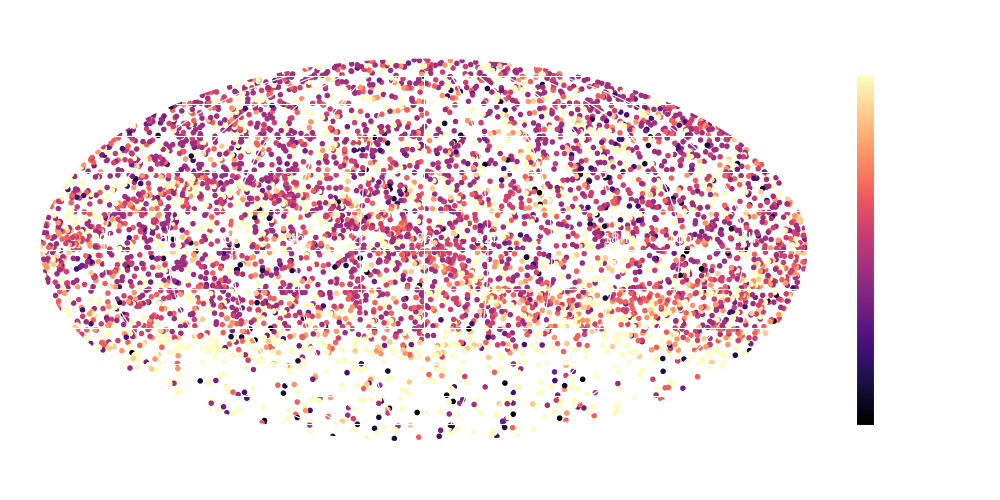
Sky maps of error ellipse semi-major axis (EESMA). | |
|
|
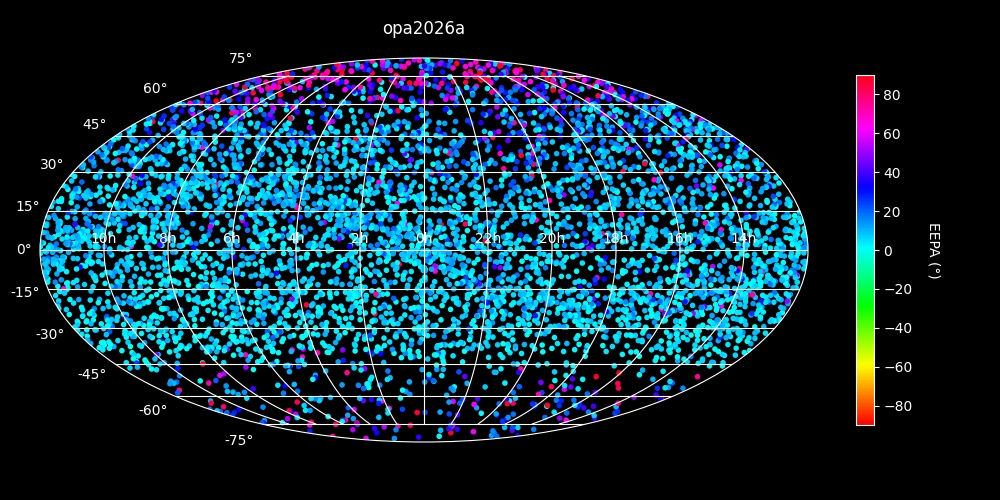
Sky maps of error ellipse position-angle (EEPA). | |
|
|
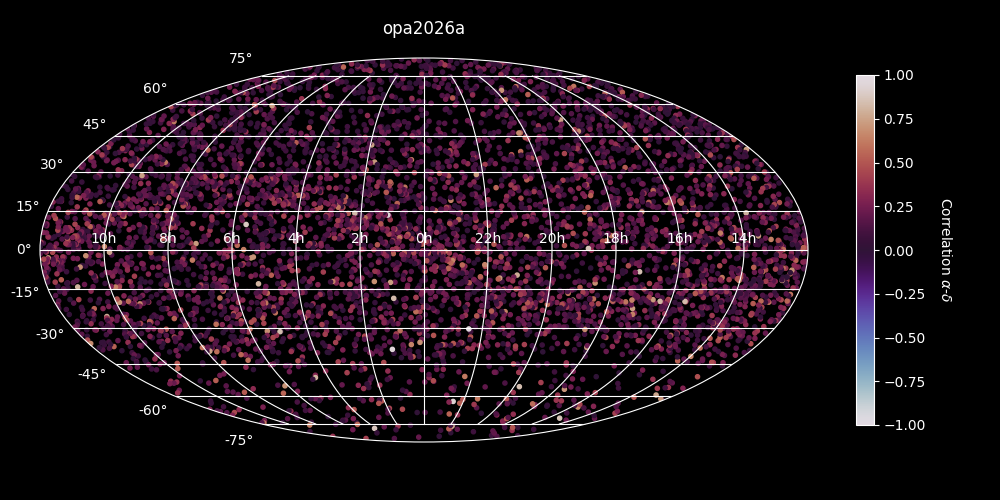
Sky maps of RA-Dec correlation. | |
|
|
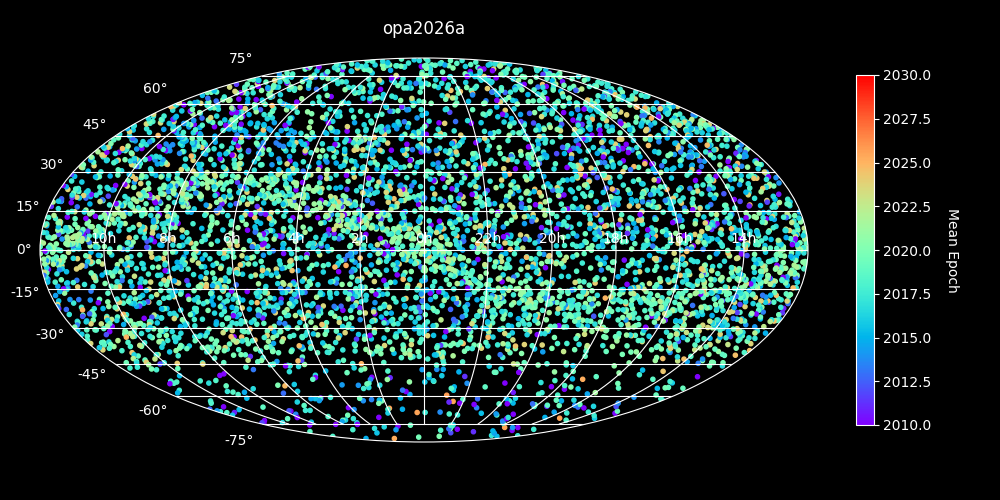
Sky maps of source mean observation epoch. | |
|
|
Sky maps of number of sessions. | |
|
|
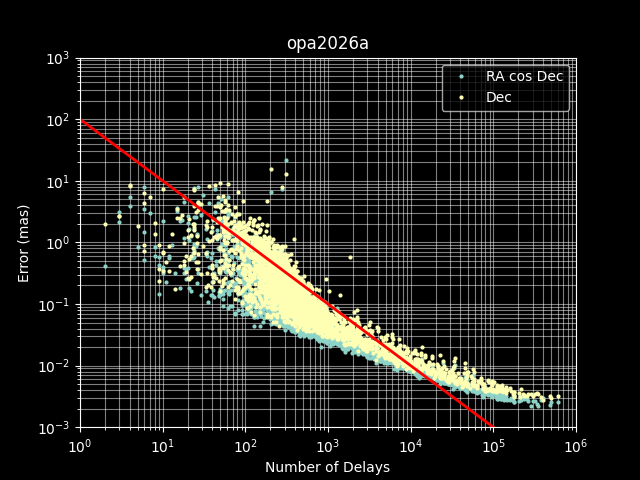
EESMA versus the number of delays. | |
|
|
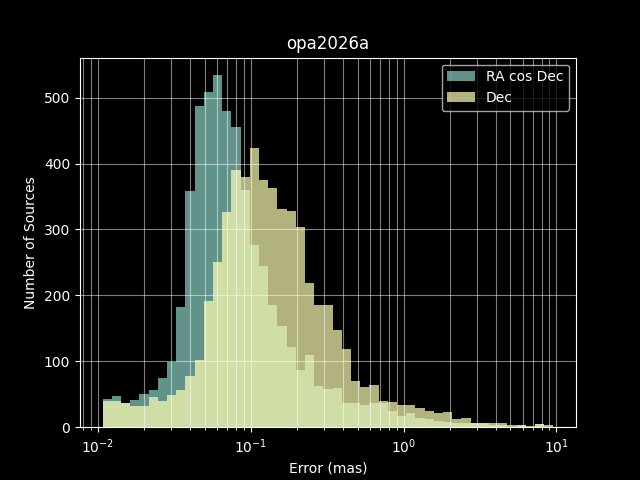
Distribution of errors in RA and Dec. | |
|
|
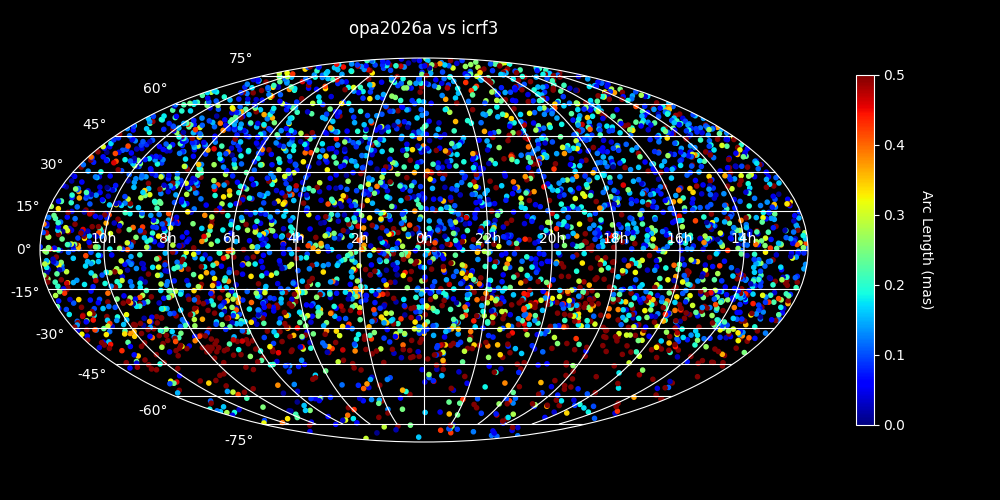
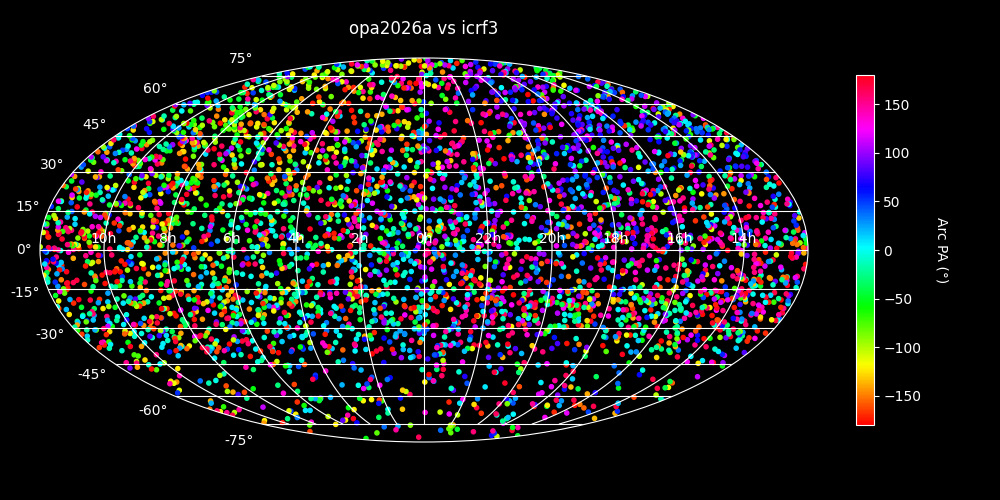
(Left) Arc length between ICRF3 and opa2026a and (Right) its position-angle. | |
|
|
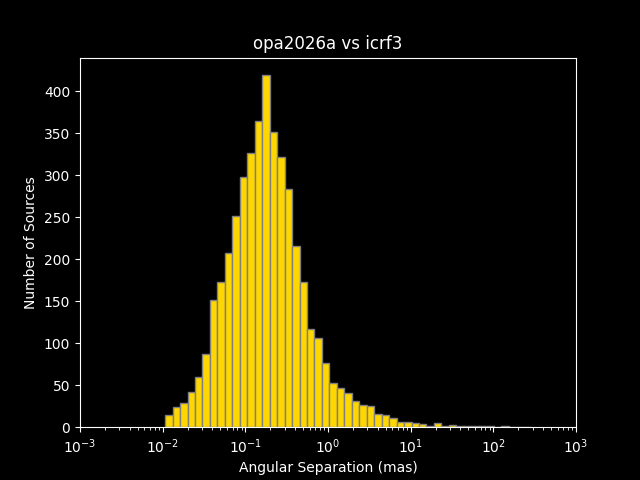
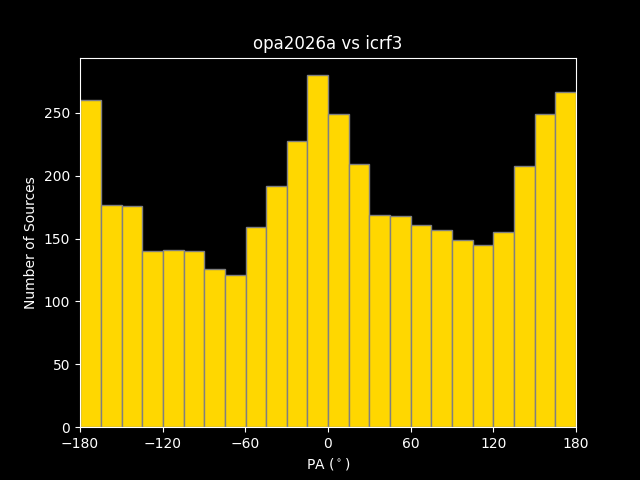
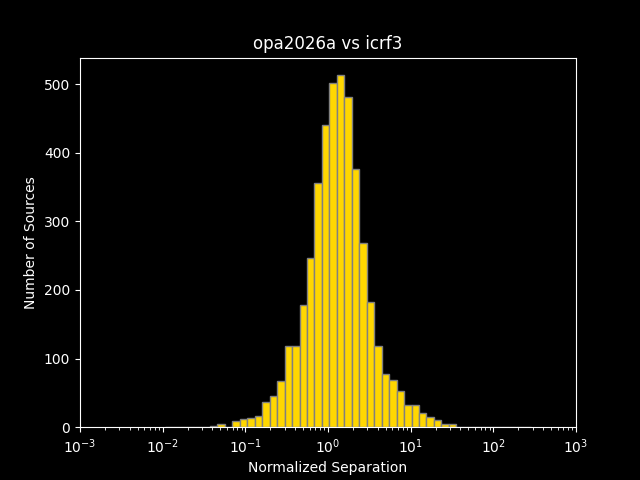
Distribution of (Left) the angular separation between ICRF3 and opa2026a, (Middle) the position-angle between ICRF3 and opa2005b positions, and (Right) the normalized separation. | ||
|
|
|
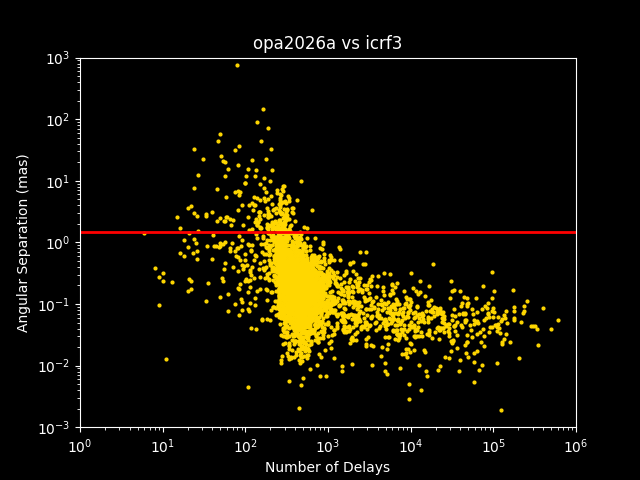
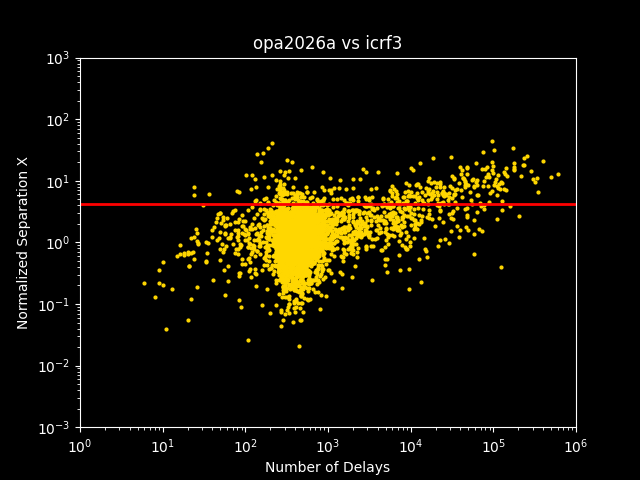
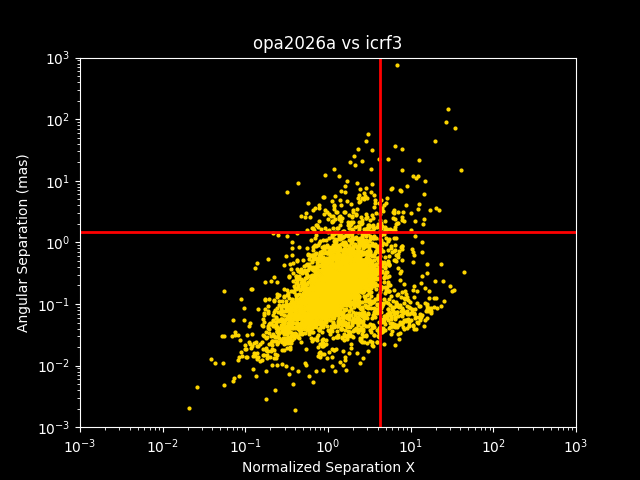
The (Left) angular and (Middle) normalized separations vs. the number of delays, and (Right) the normalized separation as a function of the angular separation. The red line on the normalized separation scale is the limit beyond which there is no expected survival source for a Rayleigh distribution of parameter 1. Conversely, the red line on the angular separation scale is the angular separation leaving only 5% of the sample beyond. | ||
|
|
|
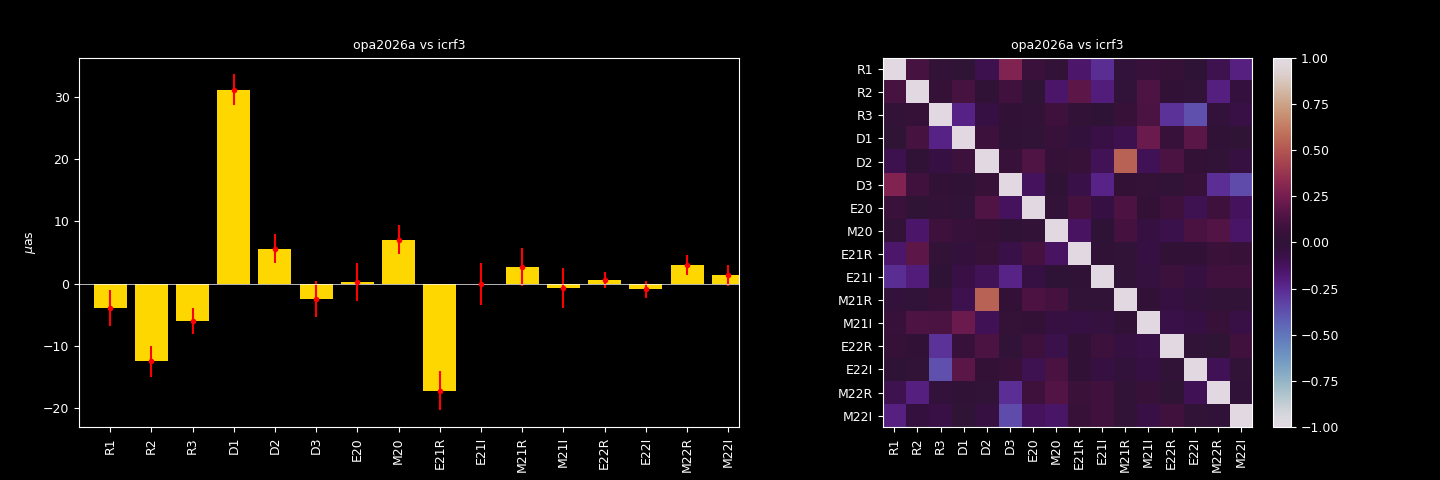
(Left) Transformation parameters between ICRF3 and opa2026a adjusted on positional differences after removal of outlier sources following the method explained in Charlot et al. (2020) and (Right) their correlations. | |
|
|
|
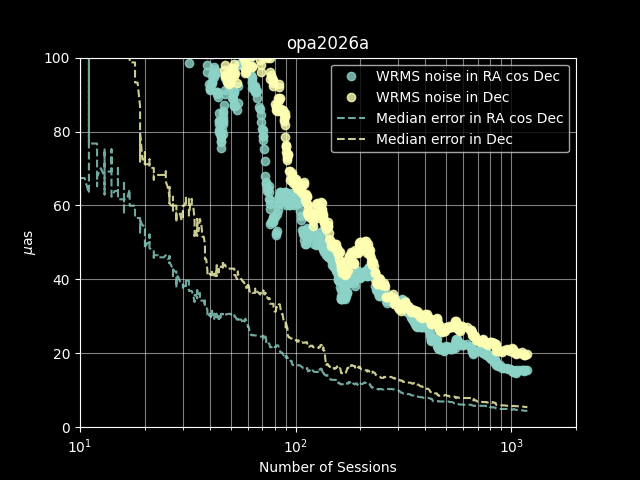
Two decimation solutions were run. For each, the position in each solution was compared. The plot represents the WRMS of position differences (WRMS noise) for bins of 50 sources sorted by number of sessions. As the number of sessions increases, the WRMS noises decreases but seems to reach a limit at about 20 microas. The dashed lines represent the source positional error (median in bins of 50 sources) that appears to be lower than the WRMS noise. The interpretation of the plot is that the positional (formal) error is underestimated and the a realistic error can be produced by inflating them with a noise floor and a scale factor added in quadrature. The adjusted value of the noise floor are within 15 and 19 microas, and the scale factor would be between 1.4 and 1.5. |
|